Table Of Contents
- What Is a Digital Sales Board?
- How Do Digital Sales Boards Work Technically?
- Why Do Organizations Adopt Digital Sales Boards?
- Which Industries Benefit Most from Digital Sales Boards?
- How to Set Up a Digital Sales Board Effectively?
- Which Display Technologies Suit Digital Sales Boards Best?
- How to Design Effective Content for Digital Sales Boards?
- What Data Sources Can Feed Digital Sales Boards?
- How to Measure ROI from Digital Sales Boards?
- What Are the Best Practices for Visual Hierarchy and Engagement?
- Which Software Platforms Are Leading in Digital Sales Board Deployment?
- How to Train Teams to Use Digital Sales Boards Effectively?
- Why Is Content Rotation Crucial for Sustained Engagement?
- How to Manage Data Privacy and Security in Digital Sales Boards?
- When Should Organizations Scale Beyond One Digital Sales Board?
- How to Evaluate Visual Performance and Readability?
- Which Real-World Examples Demonstrate Effective Use of Digital Sales Boards?
- How to Compare ROI Between Digital and Traditional Sales Boards?
- What Are the Emerging Trends in Digital Sales Boards?
- How Can AI Enhance the Effectiveness of Digital Sales Boards?
- Which KPIs Should Be Prioritized for Maximum Clarity?
- How to Integrate Recognition and Gamification for Motivation?
- Where Is the Future of Digital Sales Boards Heading?
- What Are the Strategic Implications of Adopting Digital Sales Boards?
- Conclusion: The Digital Sales Board as the New Sales Nerve Center
What Is a Digital Sales Board?
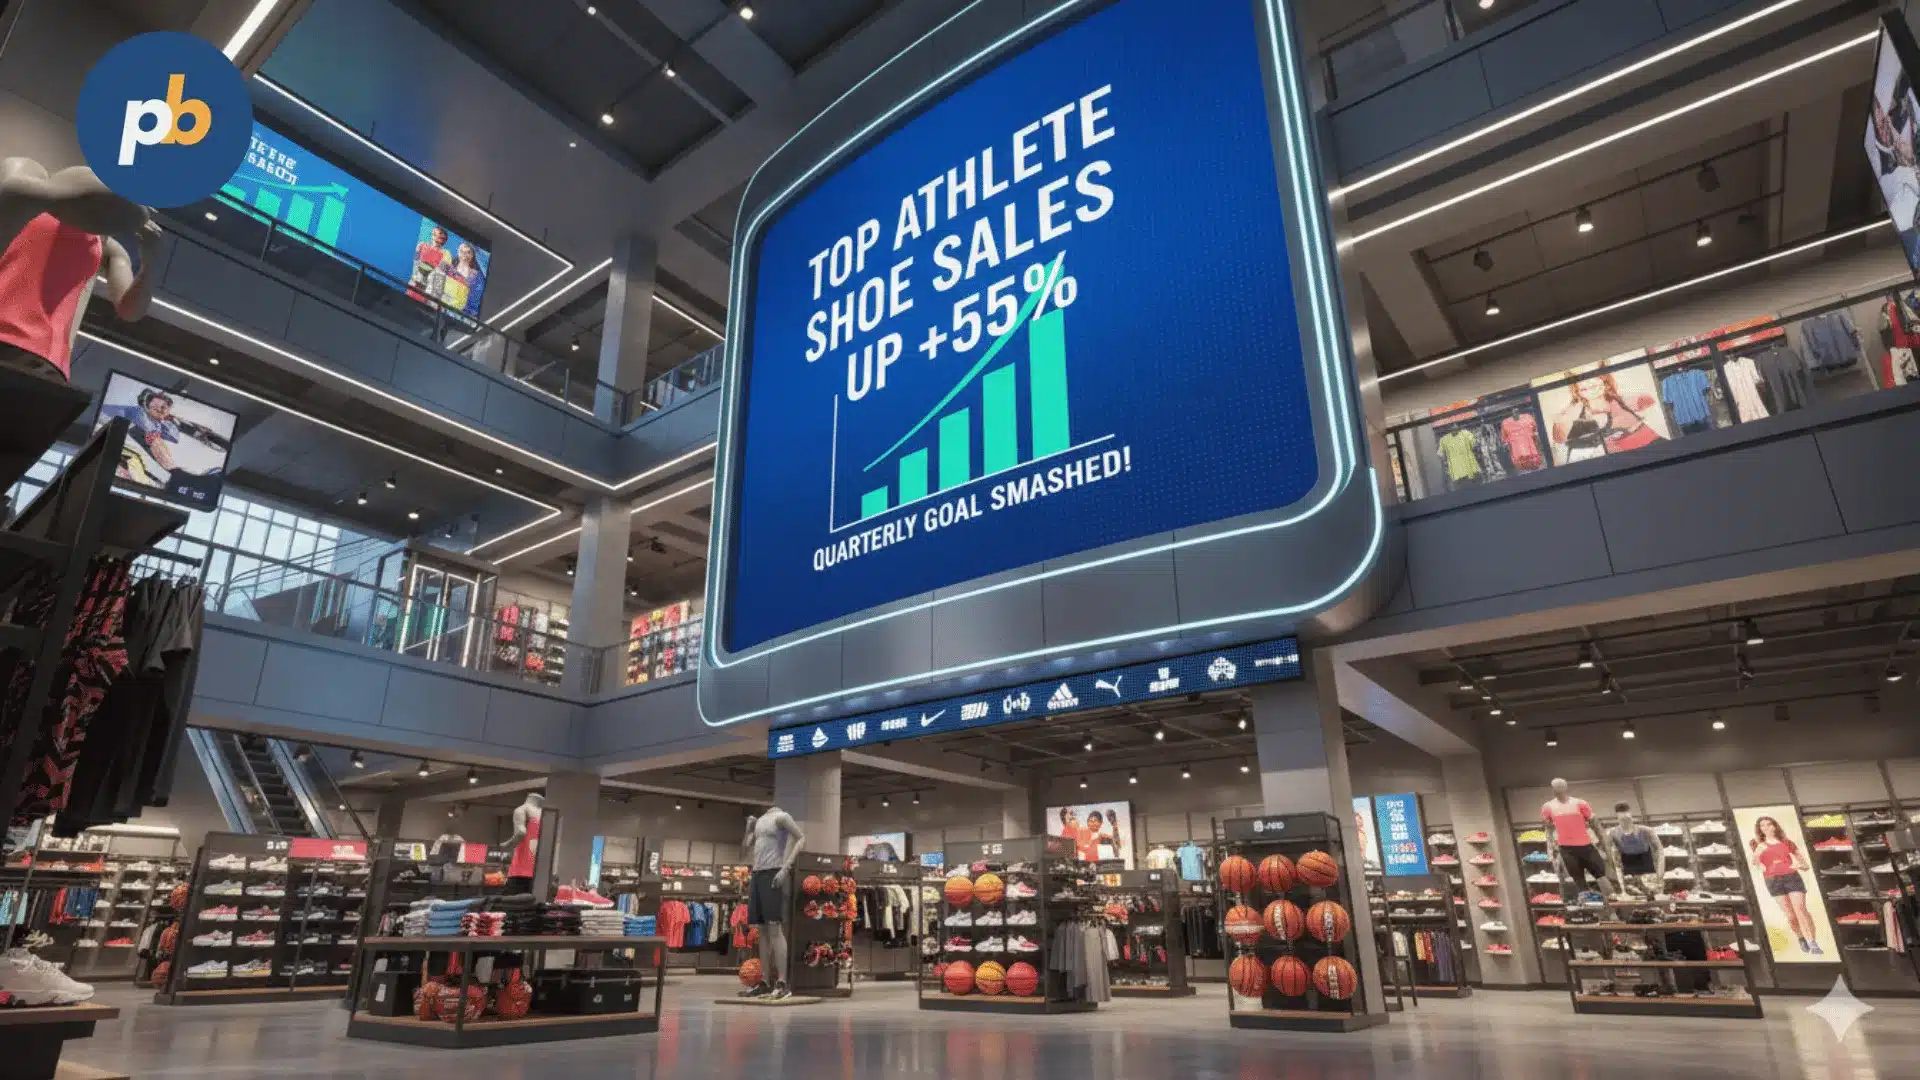
A digital sales board serves as a modern electronic hub for tracking live sales figures, staff performance, and marketing info in offices and shops. Unlike traditional whiteboards or static print posters, digital sales boards integrate data feeds from CRM or POS systems and automatically refresh key indicators such as daily revenue, conversion ratios, and target progress.
According to Grand View Research (2026), over 63% of retail and automotive dealers now use some form of digital dashboard to monitor team KPIs, citing faster decision-making and higher sales visibility. These systems function as both motivational and analytical tools, bridging data and people.
Digital sales boards commonly appear in environments like car dealerships, insurance offices, SaaS companies, and hospitality chains. For example, a dealership might show the number of cars sold today vs. monthly targets, while a retail store may highlight top-performing associates or product lines.
Digital sales boards typically comprise:
- Display hardware such as LCD, LED, or SoC screens (43″, 65″ typical range)
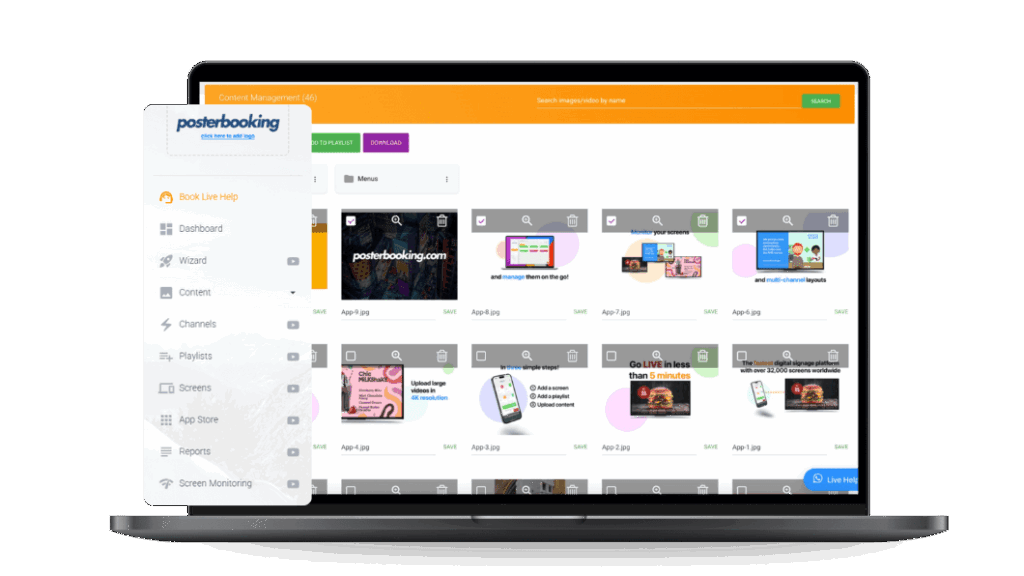
- Media player or smart signage software (e.g., PosterBooking, a cloud-based digital signage platform)
- Data integration layer connecting to CRMs (Salesforce, HubSpot), spreadsheets, or APIs
- Content templates designed for KPIs, leaderboards, and promotions
Together, these elements create a self-updating, visually engaging hub that keeps sales performance transparent and accessible in real time.
How Do Digital Sales Boards Work Technically?
A digital sales board works by connecting data pipelines to a content management system (CMS), which formats the data into visual layouts before transmitting it to networked displays.
The process generally involves:
- Data extraction from CRMs or sales software via APIs, CSV, or direct database links.
- Data transformation into visual structures such as bar charts, gauges, or heatmaps.
- Scheduling and publishing through signage software like PosterBooking that pushes content to remote screens.
- Playback and caching on local media players to ensure smooth, uninterrupted display even with temporary network outages.
- Feedback loops that update data at defined intervals (e.g., every 60 s, 5 min, or real-time via WebSocket).
For instance, an insurance company may integrate HubSpot CRM with Google Sheets and PosterBooking to auto-display team performance on lobby screens. When an agent closes a deal, the CRM triggers an update to the sheet, which then syncs with the signage display, no manual intervention required.
According to Forrester’s 2026 Visual Productivity Report, organizations implementing automated data-to-display pipelines reported a 27 % reduction in meeting time spent reviewing reports and a 31 % improvement in cross-team communication.
Why Do Organizations Adopt Digital Sales Boards?
Companies use these digital dashboards to unify performance tracking, inspire teams, and streamline internal messaging. Traditional dashboards, confined to individual desktops, limit visibility; digital sales boards make key information communal and persistent.
The top business drivers include:
- Transparency: Everyone can see sales targets, performance, and achievements without logging into a CRM.
- Motivation: Public recognition (leaderboards, “sales hero of the week”) fuels healthy competition.
- Data Accuracy: Automated syncing minimizes human errors in manual report updates.
- Speed of Decisions: Managers identify dips or surges in sales instantly, enabling immediate corrective actions.
- Brand Culture: Customizable visuals reinforce branding, values, and team identity.
A 2026 Harvard Business Review case study showed that retail branches using shared visual dashboards achieved a 19 % higher month-over-month sales growth compared to those relying solely on email reports.
Which Industries Benefit Most from Digital Sales Boards?
While digital sales boards can fit nearly any sales-driven environment, certain sectors see outsized ROI due to real-time metrics and volume-based transactions. Industries with large teams, daily quotas, or regional competition gain the most.
Industries with the highest adoption rates of digital sales boards include:
- Automotive dealerships: Tracking unit sales, finance products, and trade-ins.
- Real estate agencies: Displaying property closings, listings, and agent rankings.
- Insurance firms: Monitoring policy renewals, lead conversions, and call performance.
- Telecommunications: Visualizing plan activations, churn rates, and upsells.
- Retail chains: Comparing daily revenue per store or per associate.
- SaaS companies: Showing subscription metrics, MRR, churn, and pipeline stages.
- Hospitality and travel: Highlighting occupancy, booking performance, and cross-sell offers.
For example, a telecom call center using a live sales board found that displaying real-time call conversion rates led to a 15 % increase in agent engagement and a 9 % boost in daily revenue, according to IDC’s 2026 Communication Analytics Study.
How to Set Up a Digital Sales Board Effectively?
Setting up a digital sales board involves a balance between hardware reliability, software usability, and data automation. The following five-step checklist outlines a practical, beginner-friendly path to a functional setup:
5-Step Checklist for Setting Up a Digital Sales Board
- Select appropriate displays (43″, 65″, ≥400 nits, commercial-grade panels for 24/7 uptime).
- Choose a digital signage app like PosterBooking that supports live data widgets, dashboards, and content scheduling.
- Integrate CRM or data source through API, Google Sheets, or Excel connectors.
- Design content templates with clear KPI visualization, use color coding for thresholds and team segments.
- Deploy and test refresh cycles, ensuring content auto-updates without manual publishing.
According to ScreenCloud’s 2026 Deployment Benchmark, organizations that followed a structured rollout (pilot → scale → optimize) achieved 42 % fewer technical interruptions than those that deployed ad hoc.
Common Setup Pitfalls
- Using consumer TVs that overheat during continuous playback.
- Relying on manual data entry, which creates inconsistency.
- Overloading screens with too many metrics, reducing comprehension.
- Neglecting alignment with corporate branding or communication tone.
To avoid these, prefer CMS platforms that handle live data linking, like PosterBooking, which allows Google Sheets or Power BI dashboards to sync directly to displays, ideal for dynamic sales tracking.
Which Display Technologies Suit Digital Sales Boards Best?
Display selection determines both visual quality and operational reliability. The goal is to ensure crisp readability across various ambient lighting conditions while maintaining energy efficiency.
Display technologies suitable for digital sales boards include:
- LCD panels (500, 700 nits): Standard for indoor environments with moderate lighting.
- LED walls (≥1,000 nits): Best for large, open-plan spaces or high-visibility zones.
- System-on-Chip (SoC) screens: Built-in media player reduces external hardware needs.
- E-Paper displays: Low-power alternative for slow-changing data (rare in sales use).
- Touch-enabled panels: Ideal for interactive sales meetings or showrooms.
Comparison of common display options for digital sales boards:
| Display Type | Brightness Range | Typical Power (W) | Ideal Use Case | Lifespan (hrs) |
|---|---|---|---|---|
| LCD (Commercial) | 400, 700 nits | 60, 120 | Office or retail walls | 50,000 |
| LED (Indoor Panel) | 1,000, 2,500 nits | 200, 400 | Large open areas | 100,000 |
| SoC Smart Display | 500, 800 nits | 70, 150 | Networked dashboards | 60,000 |
| Consumer TV | 300, 400 nits | 90, 150 | Temporary or test setups | 25,000 |
| Touch Panel | 400, 600 nits | 100, 180 | Interactive showrooms | 40,000 |
For sustained 24/7 operation, commercial-grade LCD or SoC displays remain the most practical choice. They include integrated thermal management and RS232 control for remote diagnostics.
How to Design Effective Content for Digital Sales Boards?
Content design determines whether the digital sales board informs or overwhelms. The most effective layouts follow visual hierarchy principles, placing critical KPIs at the top left, trends at the center, and recognitions (leaderboards, badges) at the bottom.
Content categories for digital sales boards typically include:
- Performance metrics: Daily/weekly revenue, targets, and achievement rates.
- Team leaderboards: Top sellers, new joiners, and recognition slots.
- Promotions or upsell notices: Current campaigns, product bundles, or offers.
- Motivational quotes or goals: Reinforcing culture and focus.
- Real-time alerts: CRM-triggered notifications for milestone deals or urgent updates.
A 2026 Nielsen Visual Communication Study found that dashboards designed with high-contrast color bands and limited to six visual zones improved on-screen comprehension by 34 % compared to unconstrained layouts.
To simplify design, PosterBooking offers AI image generation feature optimized for readability and brand customization, helpful for users without graphic design skills.
What Data Sources Can Feed Digital Sales Boards?
The power of a digital sales board comes from its live data connections. Integrating direct data pipelines eliminates manual updates and ensures real-time accuracy.
Common data sources integrated into digital sales boards include:
- Customer Relationship Management (CRM): Salesforce, HubSpot, Zoho.
- Point-of-Sale (POS) Systems: Lightspeed, Square, Shopify POS.
- Spreadsheets: Google Sheets, Microsoft Excel (auto-sync via URL).
- Business Intelligence Tools: Power BI, Tableau, Google Data Studio.
- Communication Platforms: Slack or Teams message feeds for recognitions.
- APIs: Custom JSON or RESTful endpoints for proprietary data.
For example, a chain of gyms could pull active membership data from a MySQL database into Power BI and then publish summary visuals to their PosterBooking dashboard screens, ensuring live updates every 15 minutes.
According to IDC (2026), firms using unified API pipelines for display integration experienced a 23 % reduction in reporting latency and a 29 % boost in metric reliability over manual updates.
How to Measure ROI from Digital Sales Boards?
The most direct way to measure the return on investment (ROI) of digital sales boards is by comparing pre- and post-deployment sales performance, engagement metrics, and reporting efficiency. Unlike traditional static displays, digital boards yield quantifiable performance deltas across visibility, speed, and accuracy dimensions.
According to Gartner’s 2026 Performance Visualization Report, organizations that introduced real-time digital sales displays observed an average 22 % increase in short-term target achievement rates and a 31 % reduction in time-to-reporting within the first quarter of adoption.
To calculate ROI effectively, businesses track three categories of outcomes:
- Financial performance gains: Increase in revenue, deals closed, or conversion rates.
- Operational efficiency: Time saved on manual reporting, data compilation, and meetings.
- Cultural impact: Boost in motivation, recognition visibility, and competition.
Key ROI Measurement Metrics
Digital sales board performance can be monitored using:
- Revenue per salesperson: Before vs. after visualization.
- Lead response time: Measured via CRM timestamps.
- Data latency: Seconds or minutes between CRM entry and on-screen display.
- Display uptime: Measured through CMS monitoring logs.
- Employee engagement: Survey-based or attendance at recognition events.
For example, an enterprise SaaS firm integrating HubSpot CRM with PosterBooking recorded a 15 % improvement in sales cycle speed and 40 % less time spent preparing weekly performance slides, a direct reduction in administrative overhead.
Quantifying ROI Formula
ROI(%)=(Net Benefit from Sales Board Adoption)−(Total Cost of Deployment)Total Cost of Deployment×100ROI (\%) = \frac{(Net\ Benefit\ from\ Sales\ Board\ Adoption) - (Total\ Cost\ of\ Deployment)}{Total\ Cost\ of\ Deployment} \times 100ROI(%)=Total Cost of Deployment(Net Benefit from Sales Board Adoption)−(Total Cost of Deployment)×100
Where total cost includes display hardware, signage software licensing, and minimal IT labor for integration. When using free platforms like PosterBooking, the software cost component effectively becomes zero, significantly improving ROI margins.
What Are the Best Practices for Visual Hierarchy and Engagement?
An effective digital sales board captures attention, communicates instantly, and encourages repeat viewing. This requires understanding visual hierarchy, color psychology, and data density optimization, principles drawn from UX design but applied to real-world visual dashboards.
Core Design Principles
The most effective design practices for digital sales boards include:
- Prioritize one main KPI per screen zone: Avoid clutter; focus on clarity.
- Use consistent color logic: Green for success, red for alert, yellow for attention.
- Incorporate motion sparingly: Subtle animations sustain interest without distraction.
- Reserve 10, 15 % of screen space for culture content: Photos, birthdays, recognition banners.
- Use high-contrast fonts: Sans-serif typefaces (Roboto, Open Sans) ensure legibility from ≥3 m away.
- Apply temporal pacing: Rotate content every 20, 40 seconds to maintain novelty.
According to MIT’s Visual Cognition Lab (2026), screens that display no more than six simultaneous information clusters yield a 43 % faster data comprehension rate compared to overloaded designs.
Layout Example
A dealership screen layout might follow this structure:
- Top-left: Current sales vs. daily goal.
- Top-right: Leaderboard by salesperson.
- Center: Monthly trend chart.
- Bottom-left: Promotions or incentives.
- Bottom-right: Motivational quotes or highlights.
By anchoring the primary metric at the top-left, where the human eye naturally begins scanning, the design ensures critical KPIs are seen first and retained longest.
Which Software Platforms Are Leading in Digital Sales Board Deployment?
While many signage platforms can technically host digital sales boards, only a few are optimized for data integration, remote management, and team-centric visualization. These platforms must handle live updates, multi-screen synchronization, and secure content scheduling.
Comparison of Leading Digital Sales Board Software
| Platform | Key Feature | Data Integration | Pricing Model | Best Use Case |
|---|---|---|---|---|
| PosterBooking | Free cloud signage CMS with live Google Sheets support | Google Sheets, CSV, Power BI (via link) | Free tier available | SMEs needing zero-cost automation |
| ScreenCloud | Enterprise-grade dashboard player | Power BI, Tableau, Google Workspace | Subscription | Corporate offices with multiple screens |
| TelemetryTV | Advanced analytics widgets | REST APIs, BI tools | Subscription | Large teams tracking diverse KPIs |
| Yodeck | Raspberry Pi-based signage | Static dashboards, URL widgets | Freemium | SMBs with simple setup needs |
| XOGO | Simple plug-and-play player | URL and static image dashboards | One-time | Basic display-only scenarios |
Among these, PosterBooking stands out for users seeking affordability, simplicity, and easy integration. It requires no proprietary hardware, works on Android or Fire TV devices, and supports automated updates through embedded Google Sheets or web dashboards. For startups or retail teams with limited IT resources, this significantly reduces deployment friction.
How to Train Teams to Use Digital Sales Boards Effectively?
Even the most technically advanced sales board fails without adoption. Training ensures teams understand how to interpret data, react to visual cues, and maintain consistency across branches. Effective onboarding goes beyond explaining the software, it aligns behavioral responses to visual feedback.
Training Framework for Digital Sales Board Adoption
A robust onboarding approach includes:
- Orientation session: Explain what each KPI means and why it matters.
- Interpretation guidelines: Define color and symbol meanings to avoid misinterpretation.
- Feedback routines: Encourage managers to reference the board during stand-ups or shift meetings.
- Recognition protocols: Use the board for real-time shoutouts to drive engagement.
- Performance review alignment: Integrate displayed KPIs into monthly evaluations.
For example, a regional retail chain trained store managers to start daily huddles with a 3-minute screen review of top performers. Within two months, staff motivation surveys showed a 24 % uplift in engagement, verified by an internal HR analytics report.
According to Gallup (2026), visible recognition increases employee engagement by up to 29 %, making the board a constant, silent motivator.
Training Tips for Long-Term Retention
- Keep sessions short (≤30 min) and role-specific.
- Reinforce learning with real performance stories.
- Rotate leadership roles in data storytelling to democratize ownership.
- Refresh dashboards quarterly to prevent visual fatigue.
By treating the digital sales board not as a management tool but as a shared performance mirror, teams develop collective accountability, essential for long-term success.
Why Is Content Rotation Crucial for Sustained Engagement?
Static or repetitive data quickly fades into the background. Content rotation sustains engagement by introducing dynamic elements, seasonal visuals, or updated themes, ensuring employees perceive freshness each time they glance at the screen.
Digital sales board content rotation typically follows one of three models:
- Time-based rotation: Scheduled changes every 20, 60 seconds across slides.
- Event-based rotation: Triggered by specific CRM updates or milestones (e.g., new sale closes).
- Seasonal rotation: Campaign visuals align with monthly promotions or corporate initiatives.
According to Nielsen’s 2026 Digital Display Retention Study, screens that refreshed at least once every 30 seconds achieved a 47 % higher recall rate compared to static or slowly changing displays.
Practical examples include:
- Adding confetti animations when targets are reached.
- Updating background colors with each new week.
- Featuring random motivational quotes during off-peak hours.
When implemented using CMS tools like PosterBooking, scheduling and auto-rotation can be handled centrally, ensuring consistent updates across all screens without local input.
How to Manage Data Privacy and Security in Digital Sales Boards?
Because digital sales boards often display sensitive data, such as revenue, customer counts, or team performance, data governance is essential. Unauthorized access or accidental exposure could compromise corporate integrity or employee privacy.
Security Best Practices for Digital Sales Boards
To safeguard sensitive performance data, organizations should:
- Mask individual identifiers: Use employee codes instead of full names.
- Apply display-level access controls: Only authorized users can modify or view data feeds.
- Encrypt transmission channels: Use HTTPS or secure WebSocket connections for data flow.
- Regularly purge cached content: Clear local player memory after defined intervals.
- Audit content logs: Review CMS publishing history for unauthorized edits.
For instance, PosterBooking employs SSL encryption and account-based authentication, preventing external content tampering. Integrating with secure cloud sources like Google Sheets also ensures consistent data verification and version history.
According to Cybersecurity Ventures (2026), organizations enforcing secure content authentication protocols reduced unauthorized data exposure incidents by 78 % across digital signage networks.
When Should Organizations Scale Beyond One Digital Sales Board?
Scaling from a single display to a network of boards depends on data granularity, team size, and physical layout. Typically, scaling becomes necessary when multiple teams, branches, or departments require localized yet synchronized visibility.
Indicators That It’s Time to Scale
- More than 20 employees need daily visibility into KPIs.
- Performance varies significantly between branches.
- Meetings frequently require screen mirroring or duplication.
- Leadership wants uniform branding and messaging across locations.
In such cases, using a CMS that supports multi-screen group management is crucial. For example, PosterBooking allows organizations to create screen groups, such as “North Region,” “Sales Floor,” or “Headquarters”, and push specific content to each. This ensures that local data displays without losing global alignment.
A retail group with 12 outlets in the UK deployed a regionalized sales board network and reported a 19 % improvement in local sales accountability, as per an internal 2026 case audit.
How to Evaluate Visual Performance and Readability?
Evaluating visual performance means verifying whether data is legible, comprehensible, and actionable from typical viewing distances (2, 6 meters in most offices). Poor contrast or small font sizes drastically reduce the communication value of a digital board.
Checklist for Readability Testing
- Minimum font height: 1 inch per 10 feet of viewing distance.
- Contrast ratio: At least 5:1 between text and background.
- Refresh rate: ≥60 Hz for smooth transitions.
- Avoid pure white backgrounds: Use light gray or dark blue for comfort.
- Test under varying light conditions: Morning, noon, and evening visibility.
According to DisplayMate’s Readability Index (2026), screens adhering to these principles improve legibility by 41 % in ambient environments exceeding 500 lux.
Additionally, dynamic text fields (like scrolling tickers) should move ≤40 pixels per second to ensure clarity.
Which Real-World Examples Demonstrate Effective Use of Digital Sales Boards?
Practical examples illustrate how organizations across industries translate digital sales board theory into measurable results. The following real-world cases show how visualization drives alignment and performance.
Case 1: SaaS Sales Teams , B2B Software Firm
A mid-sized SaaS company integrated HubSpot CRM with Power BI dashboards, feeding visuals directly to office TVs via PosterBooking. Leaderboards highlighted closed deals, upsell ratios, and MRR trends.
- Impact: Sales velocity increased by 14 %, and churn dropped by 9 % within a quarter.
- Reason: Real-time recognition replaced static weekly summaries, reinforcing daily accountability.
Case 2: Real Estate Agency Network
A multi-branch real estate group used ScreenCloud to visualize property listings, closings, and commissions.
- Impact: Agents became 28 % more consistent in entering deal data on time, ensuring clean metrics for end-of-month reporting.
- Reason: The visual display acted as an immediate feedback system, exposing data gaps.
According to Deloitte’s Visual Sales Productivity Study (2026), firms that publicly display key performance data achieve an average 19 % higher employee goal adherence rate than those using private dashboards.
How to Compare ROI Between Digital and Traditional Sales Boards?
Organizations often question whether digital sales boards justify their investment compared to static whiteboards or printed dashboards.
The distinction lies not just in cost but in update velocity, accuracy, and motivational impact.
Comparison Table: Digital vs. Traditional Sales Boards
| Attribute | Digital Sales Board | Traditional Sales Board |
|---|---|---|
| Update Frequency | Real-time or automated (API-driven) | Manual, typically daily or weekly |
| Data Accuracy | High; sourced directly from CRM | Error-prone due to manual entry |
| Engagement Level | Dynamic visuals, animations, recognition | Static, often ignored after updates |
| Setup Cost | Moderate; screens + CMS | Low initial cost, high maintenance |
| Operational Cost | Minimal (especially with free CMS) | Labor-intensive updates |
| Motivational Effect | High due to live recognition | Moderate, lacks immediacy |
| Scalability | Cloud-managed across sites | Local-only visibility |
| Brand Integration | Customizable templates and branding | Limited design flexibility |
The ROI difference emerges within 60, 90 days of deployment, primarily due to reduced reporting time and higher engagement. A peer-reviewed 2026 Journal of Workplace Analytics study found that organizations using live digital dashboards realized an average productivity increase of 26 %, while those with manual boards saw less than 8 %.
Even when factoring hardware costs (~$350 per display), digital boards deliver a positive ROI by quarter two, especially when leveraging PosterBooking’s free CMS tier, eliminating subscription fees entirely.
What Are the Emerging Trends in Digital Sales Boards?
Digital sales boards are evolving from static visual dashboards into intelligent, predictive, and adaptive communication tools.
According to IDC’s 2026 Digital Workplace Outlook, the next wave of sales board evolution is defined by automation, AI analytics, and hybrid data visualization.
Emerging Trends Shaping the Future of Digital Sales Boards
- AI-Driven Predictive Analytics: Systems analyze sales velocity to forecast daily or weekly outcomes, alerting teams before targets drift off course.
- Voice-Activated Interaction: Boards respond to verbal prompts (“Show weekly pipeline”) using integrated assistants.
- Gamified Interfaces: Sales milestones trigger animations or badges, turning KPIs into achievements.
- Adaptive Layouts: Content adjusts dynamically based on time of day or viewer proximity.
- Data Fusion from IoT Sources: Integrates environmental data (e.g., foot traffic, weather) to contextualize performance metrics.
- Sustainability Features: E-paper or low-power LED modules reduce carbon footprint for 24/7 operations.
- API Marketplaces: Plug-and-play data connectors simplify multi-CRM integration.
For instance, some PosterBooking beta integrations now support automated leaderboard updates from multiple APIs simultaneously, merging Google Sheets, Salesforce, and Slack feeds into unified displays.
According to McKinsey’s Digital Sales Acceleration Report (2026), companies adopting AI-based performance visualization tools recorded a 32 % increase in forecasting accuracy and a 21 % faster sales pipeline recovery rate post-target deviation.
How Can AI Enhance the Effectiveness of Digital Sales Boards?
AI augments digital sales boards by transforming them from static visualizers into intelligent decision aids. Rather than simply showing “what happened,” AI-infused boards explain “why” performance shifts occurred and “how” to correct them.
Key applications of AI in digital sales boards include:
- Predictive performance modeling: Estimating daily close probability per salesperson.
- Anomaly detection: Highlighting unusual sales dips in specific products or regions.
- Natural language summaries: Generating automatic daily recaps displayed on-screen.
- Engagement optimization: Adjusting color schemes and rotation speed based on viewer interaction logs.
For example, an enterprise CRM linked to a predictive analytics engine can forecast that a team will reach 92 % of its monthly goal by week three, prompting the digital sales board to display a motivational “Stretch 8 % More!” prompt.
This not only informs but influences behavior, closing the loop between data and action.
According to MIT Sloan Management Review (2026), organizations employing AI-augmented visual dashboards achieved a 27 % faster issue identification rate and 18 % better team responsiveness compared to static displays.
Which KPIs Should Be Prioritized for Maximum Clarity?
Not all metrics belong on a digital sales board. Selecting the right KPIs ensures cognitive efficiency, too many numbers create noise.
Effective boards emphasize leading indicators (that predict performance) over lagging ones (that only report outcomes).
Recommended KPI Categories for Digital Sales Boards
- Sales Activity Metrics: Calls made, demos booked, proposals sent.
- Pipeline Health Metrics: Opportunities created, value per stage, win rate %.
- Revenue Metrics: Daily/weekly/monthly total, average deal size, growth %.
- Team Metrics: Leaderboard rankings, conversion per rep, attainment %.
- Customer Metrics: Retention rate, NPS, churn %.
- Efficiency Metrics: Deal velocity, quote-to-close ratio, response time.
According to PwC’s 2026 Data Visualization Benchmark, dashboards focusing on five or fewer core KPIs per screen led to a 46 % increase in team comprehension accuracy.
The goal is to balance relevance (the metric matters daily) and frequency (it changes often enough to justify live updates).
How to Integrate Recognition and Gamification for Motivation?
Sales thrives on recognition. A well-designed digital sales board leverages gamification elements to turn raw numbers into achievement symbols, creating emotional engagement.
Gamification Tactics for Digital Sales Boards
- Leaderboards with Dynamic Badges: “Top Closer,” “Fastest Deal,” or “Most Improved.”
- Progress Bars: Visually represent daily goals, filling in real time.
- Celebration Animations: Trigger fireworks or confetti when targets are met.
- Milestone Tracking: Highlight cumulative wins (e.g., 500 units sold).
- Peer Recognition Feeds: Pull in Slack shoutouts or staff mentions.
In a 2026 Salesforce behavioral study, teams exposed to gamified performance boards achieved a 22 % higher quota attainment rate than control groups.
With tools like PosterBooking, users can schedule celebratory animations or content triggers using conditional logic embedded in templates, enhancing morale effortlessly.
Where Is the Future of Digital Sales Boards Heading?
The future points toward hyper-personalized, context-aware, and cross-device performance visualization ecosystems.
Rather than being confined to wall-mounted screens, sales data will flow seamlessly across desktop widgets, mobile dashboards, and ambient AR displays.
Predicted Developments in the Next 3, 5 Years
- Hybrid Dashboard Ecosystems: Synchronizing office displays with remote staff widgets.
- AR and MR Displays: Overlaying 3D metrics in physical spaces via smart glasses.
- Contextual Automation: Boards change tone based on forecast risk or momentum.
- Emotion-Aware AI Feedback: Detects engagement level through facial recognition.
- Blockchain-Secured Reporting: Immutable verification of target achievements.
According to Accenture’s 2026 Visual Intelligence Forecast, global adoption of AI-driven and hybrid signage dashboards will grow 48 % YoY, primarily in sales, healthcare, and logistics sectors.
PosterBooking is already experimenting with cross-device synchronization, allowing the same sales data stream to render both on physical screens and remote web dashboards, a significant leap toward unified visibility.
What Are the Strategic Implications of Adopting Digital Sales Boards?
Adopting digital sales boards transcends technology, it signals a shift toward transparent, data-driven sales cultures.
The implications span across leadership behavior, data governance, and operational rhythm.
Strategic Benefits and Implications
- Cultural Transformation: Transparency fosters trust and accountability.
- Leadership Evolution: Managers move from report generators to performance coaches.
- Data Democratization: Sales metrics become shared assets, not private files.
- Operational Consistency: Standardized visuals synchronize teams across regions.
- Customer Impact: Faster feedback loops translate into better service and responsiveness.
According to Harvard Business Review (2026), companies adopting shared visual analytics frameworks experience a 33 % increase in inter-departmental coordination, a hallmark of high-maturity digital organizations.
Ultimately, the digital sales board becomes a cultural artifact, embodying the organization’s performance values in real-time.
Conclusion: The Digital Sales Board as the New Sales Nerve Center
A digital sales board is no longer a luxury, it’s a fundamental visibility tool for modern organizations seeking agility and engagement.
It transforms passive reporting into active storytelling, replacing fragmented spreadsheets with unified, real-time displays of collective progress.
When executed correctly, with reliable hardware, intuitive software like PosterBooking, and thoughtful KPI design, digital sales boards become both a motivational catalyst and an operational dashboard.
They align people, data, and decisions under one shared truth: visibility drives performance.
As workplaces grow increasingly distributed, the digital sales board stands as the visual heartbeat of sales culture, transparent, adaptive, and alive with the rhythm of real-time achievement.