Table Of Contents
- What Does Screen Ratio Mean in Digital Signage?
- Common Screen Ratios and Their Best Use Cases
- How Do Screen Resolutions Affect Image and Video Quality?
- Typical Digital Signage Resolution Tiers
- Why Does Pixel Density Matter for Screen Clarity?
- How to Match Content Design to Screen Ratio and Resolution
- A 5-Step Checklist for Screen-Ready Content Design
- Which Common File Formats Are Used in Digital Signage?
- File Format Comparison for Digital Signage
- How Do Multi-Screen and Video Wall Configurations Affect Ratio and Resolution?
- How to Optimize File Encoding and Bitrate for Smooth Playback?
- Why Does Color Depth and Chroma Subsampling Affect Display Quality?
- How to Prepare Content for LED vs LCD Displays?
- Which File Formats Are Best for Transparency and Overlay Effects?
- How Do Compression and File Size Impact Network Distribution?
- How to Maintain Visual Uniformity Across Mixed Hardware?
- How Does Orientation, Scaling, and Cropping Impact Content Presentation?
- Which Export Settings Work Best in Common Design Software?
- Recommended Export Settings by Application
- How to Optimize Dynamic and Scheduled Playback for Performance?
- How Do Different Screen Sizes and Viewing Distances Influence Design Choices?
- Design Implications by Distance
- Why Does Frame Rate Matter for Visual Smoothness?
- How to Balance File Size, Quality, and Upload Efficiency?
- What Are the Broader Implications of Proper Screen Ratio and Format Management?
- Appendix
- Appendix A. Conversion Reference Table for Common Screen Resolutions
- Appendix B. Recommended Bitrates by Resolution (H.264 / H.265)
- Appendix C. Color Management Guidelines
- Appendix D. Export Template Settings for Designers
- Appendix E. PosterBooking Platform Advantages
- Appendix F. 5-Step Rapid Content Validation Workflow
- Glossary of Terms
- Aspect Ratio
- Resolution
- Pixel Density (PPI)
- Bitrate
- Codec
- Chroma Subsampling (4:4:4 / 4:2:0)
- Color Depth (Bit Depth)
- Nits
- Pillarboxing / Letterboxing
- Alpha Channel
- Progressive Scan (p)
- Interlaced Scan (i)
- Safe Zone
- Up/Downscaling
- Latency
- Frame Rate (fps)
- Color Temperature
- Gamma Curve
- Content Management System (CMS)
- Transcoding
- HDR (High Dynamic Range)
- Visual Uniformity
- Bandwidth
- LUT (Look-Up Table)
- Content Loop
- Playback Cache
- Adaptive Scaling
- PosterBooking
- Color Gamut
- Dynamic Scheduling
- Media Player (Signage Player)
- Content Template
- Screen Grouping
- Brightness Scheduling
- Pixel Pitch (LED Displays)
- Safe Frame
- Image Compression
- Playback Sync
- Firmware Update (for Displays or Players)
- Viewing Distance
- Orientation (Landscape/Portrait)
- Playback Zone
- Heatmap Analytics (Advanced CMS Feature)
- Color Calibration
- Upstream Bandwidth
- Display Orientation Lock
What Does Screen Ratio Mean in Digital Signage?
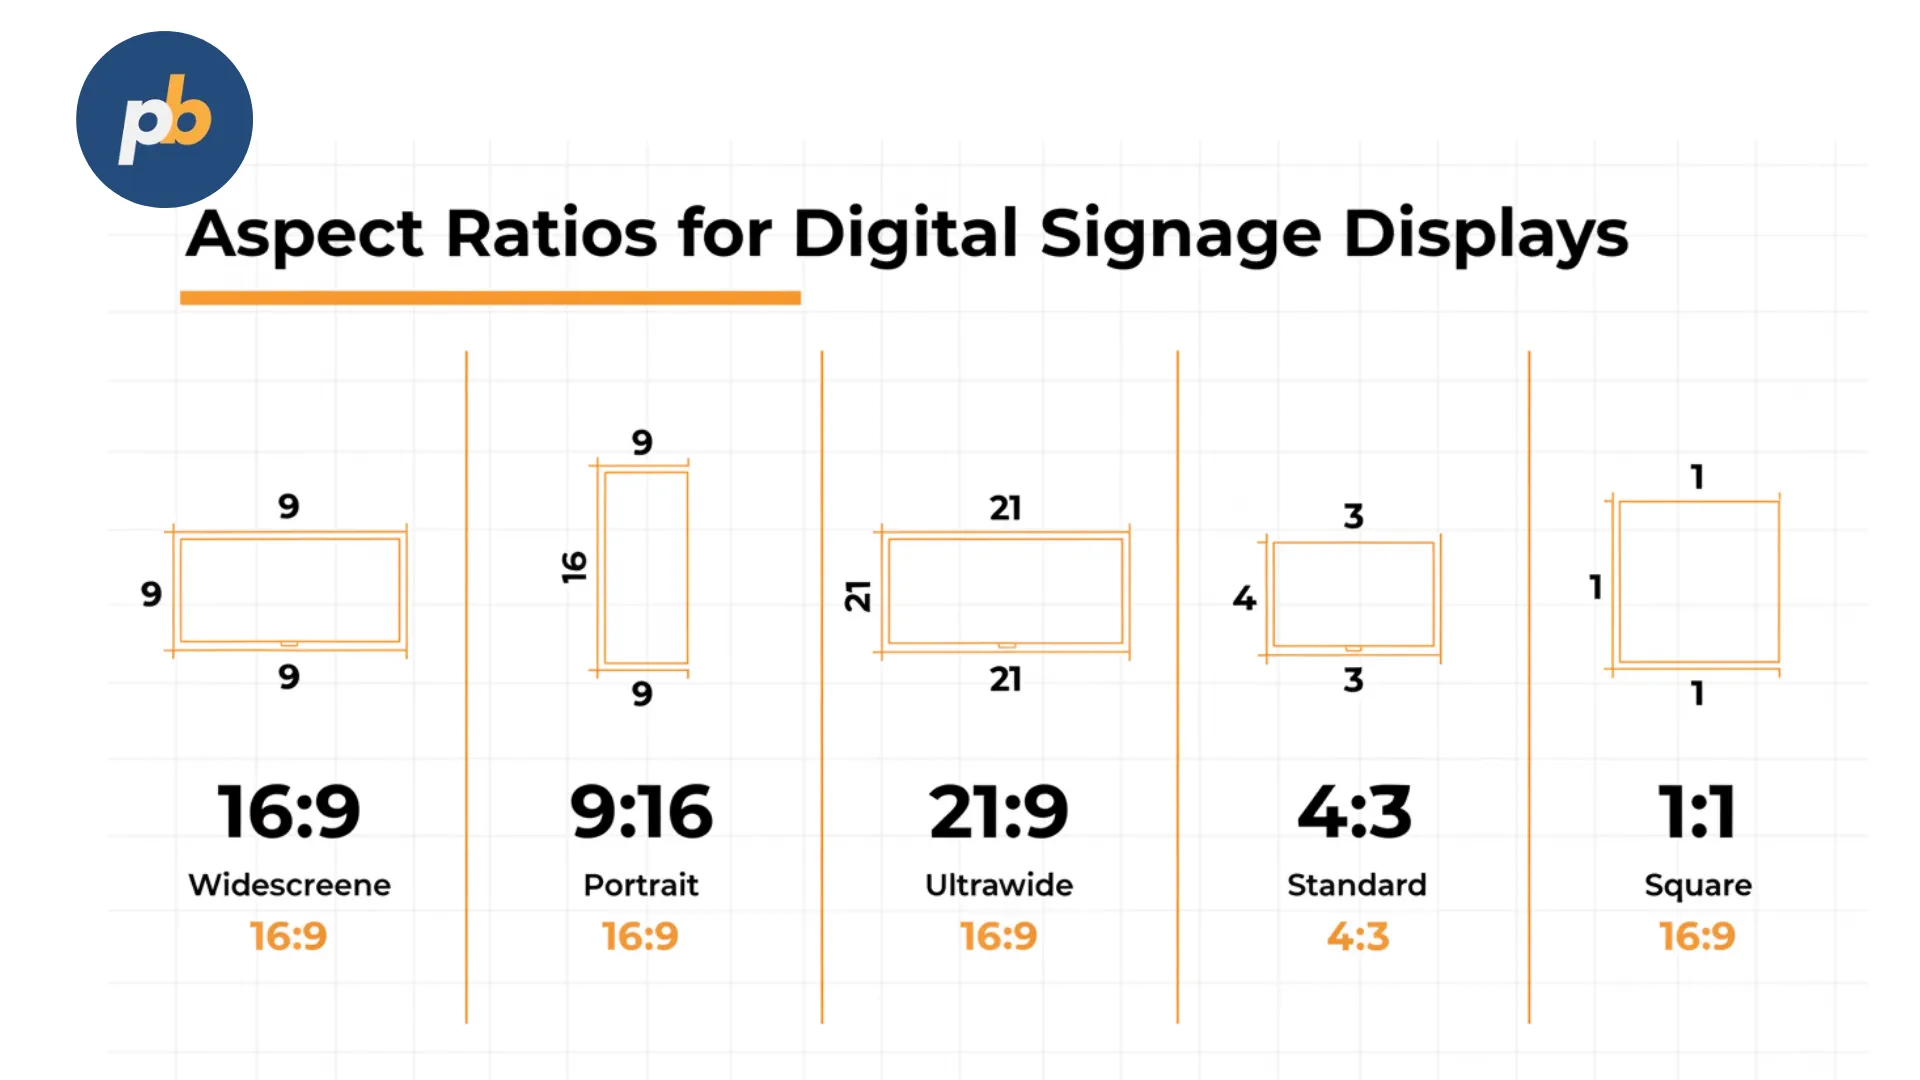
Screen ratio, also known as aspect ratio, defines the proportional relationship between a display’s width and height. In simple terms, it tells you how wide the screen is compared to how tall it is. The most common screen ratios in digital signage are 16:9 (widescreen), 9:16 (portrait), and 4:3 (standard).
According to Display Specifications Database (2026), 16:9 screens make up over 87% of commercial signage installations worldwide, mainly because they align with the native ratio of most HD and 4K displays. This ratio is perfect for landscape-oriented content like menu boards, dashboards, or advertising screens mounted horizontally.
By contrast, 9:16 is simply the vertical rotation of 16:9. It’s the format most used for social-style vertical signage , the same orientation used by smartphones and short-form video content. It performs exceptionally well for retail window displays, elevators, and digital posters where vertical space is limited.
Finally, 4:3 remains in circulation for older legacy screens or certain embedded displays in transportation and healthcare sectors. While it’s less cinematic, it works well for compact, square signage zones where symmetry matters more than immersion.
When designers mismatch content with aspect ratio, the visual result is stretching, black bars, or cropping , all signs of unoptimized design. To avoid this, content creators should always design natively in the screen’s ratio rather than trying to crop later.
Common Screen Ratios and Their Best Use Cases
Screen ratio categories in digital signage typically include:
- 16:9 (Widescreen): Standard for TVs, video walls, conference displays, and menu boards
- 9:16 (Portrait): Common in retail windows, elevators, digital posters, and social-style signage
- 4:3 (Standard): Legacy ratio for older displays, control rooms, or small information kiosks
- 21:9 (Ultra-wide): Premium panoramic signage or immersive environments such as cinemas or airport banners
- 1:1 (Square): Used in Instagram-style displays or modular LED walls where symmetry is part of the aesthetic
A practical example can be seen in Samsung’s The Wall series, which uses a modular 1:1 ratio allowing designers to tile multiple panels seamlessly into either 16:9 or 9:16 configurations. This flexibility demonstrates how aspect ratio is not just geometry , it defines storytelling space.
How Do Screen Resolutions Affect Image and Video Quality?
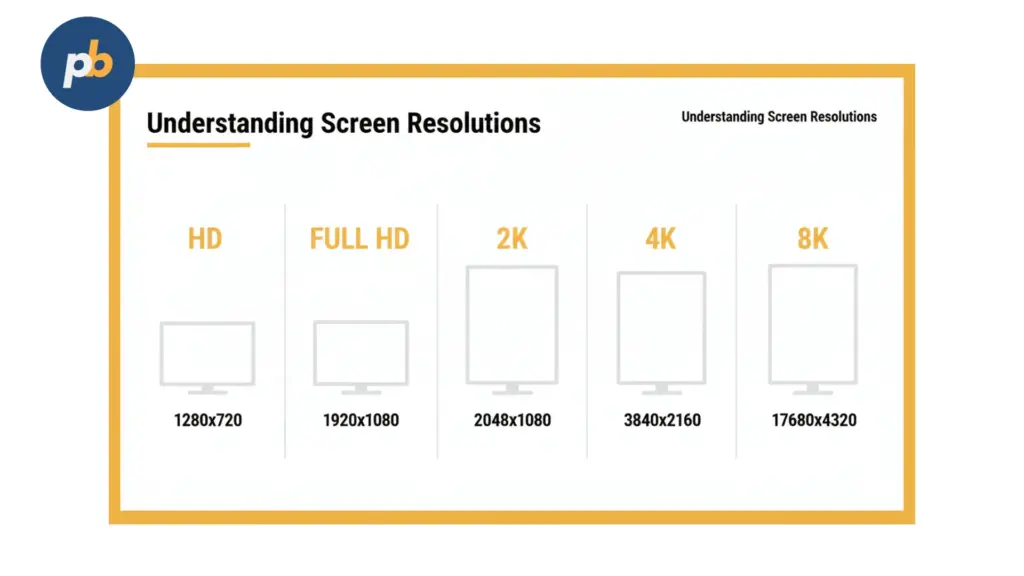
Resolution determines how many pixels make up a digital signage image. The higher the resolution, the more detailed and crisp the display appears. According to Panasonic Visual Systems (2026), the three most relevant resolutions for signage are Full HD (1920×1080), 4K UHD (3840×2160), and 8K (7680×4320).
Each pixel is a building block of color. More pixels mean smoother gradients, finer edges, and sharper text , all essential for close-view environments like retail counters or wayfinding kiosks. However, resolution choice must balance clarity with content rendering load. A poorly optimized 4K loop on a low-end player can cause lag, stutter, or frame drops.
Typical Digital Signage Resolution Tiers
| Resolution Name | Pixel Dimensions | Pixel Count | Best Viewing Distance | Ideal Use Case |
|---|---|---|---|---|
| HD (720p) | 1280×720 | ~0.9M | ≥3 m | Small kiosks, secondary displays |
| Full HD (1080p) | 1920×1080 | ~2.1M | 2–4 m | Standard indoor displays |
| 4K UHD | 3840×2160 | ~8.3M | 1–3 m | Retail, airports, premium displays |
| 8K UHD | 7680×4320 | ~33.2M | ≤1.5 m | Luxury signage, fine-art walls |
According to LG Business Solutions (2026), upgrading from 1080p to 4K yields a 62% improvement in perceived sharpness at standard indoor viewing distances, though it increases content size and network load by roughly 48%. Therefore, choosing resolution isn’t just about clarity , it’s a data bandwidth decision.
For example, a retail store displaying 4K motion graphics across 20 screens can easily exceed 60 GB of daily data transfer if not compressed efficiently. Solutions like PosterBooking , a free digital signage software for up to 10 screens , optimize this by auto-scaling videos to the native resolution of each display, avoiding unnecessary bitrate waste.
Why Does Pixel Density Matter for Screen Clarity?
Pixel density, measured in pixels per inch (PPI), determines how closely packed the pixels are on a display. Two screens can share the same resolution but look different if one is physically smaller , the smaller one will have a higher PPI and thus appear sharper.
According to SID Journal (Society for Information Display, 2022), increasing pixel density from 100 PPI to 200 PPI can yield up to 40% better text readability and 30% lower eye strain for prolonged content exposure.
In digital signage, pixel density has practical thresholds:
- ≤100 PPI: Sufficient for large outdoor billboards where viewing distance exceeds 5 meters.
- 100–150 PPI: Ideal for indoor wall-mounted screens and retail banners.
- ≥200 PPI: Used for tablet-sized touchscreens, information kiosks, and premium video walls.
For example, an outdoor LED display measuring 3×5 meters at a P6 pixel pitch (6 mm between LED centers) has a much lower pixel density than an indoor 55″ 4K screen. Yet both can appear equally clear at their intended viewing distances because human visual acuity adapts to distance.
This relationship is known as the “visual resolution-perception balance”, where beyond a certain pixel density, added detail becomes invisible to the naked eye. Therefore, designers should match resolution not to prestige but to real viewing distance and content type.
How to Match Content Design to Screen Ratio and Resolution
To produce professional, pixel-perfect signage, content creators must design to match the exact ratio and resolution of the target display. Doing so prevents stretching, cropping, or pillarboxing (black bars).
According to Adobe Digital Media Insights (2026), 72% of signage playback issues come from content created in mismatched aspect ratios or unscaled resolutions. Designers should always start their project canvas in the native display resolution and orientation.
A 5-Step Checklist for Screen-Ready Content Design
- Identify Screen Specifications: Confirm display ratio (e.g., 16:9) and resolution (e.g., 3840×2160).
- Set Design Canvas Correctly: Match the exact resolution in your design software (e.g., Photoshop, After Effects).
- Maintain Safe Zones: Keep key text and logos within a 5–10% margin to prevent edge cropping.
- Test Playback Early: Render a short 5-second loop to verify alignment and scaling on an actual display.
- Export in Native Orientation: Save as landscape or portrait based on installation setup , avoid rotating post-export.
Following this workflow ensures content stays crisp and proportionally accurate on all screens, reducing costly rework or re-rendering later.
An effective example is seen in Nike’s flagship retail stores, where vertical LED pillars run in 9:16 portrait mode. Their content is designed natively at 1080×1920, matching pixel-for-pixel with each screen. The result is perfectly proportioned motion art with no visual distortion , a direct outcome of design-dimension discipline.
Which Common File Formats Are Used in Digital Signage?
File format determines how your visual content is encoded, compressed, and played back. For digital signage, the right file type balances quality, file size, and compatibility with players or media controllers.
The most reliable digital signage formats include:
- MP4 (H.264/H.265): Industry standard for video; great balance of quality and compression
- MOV: High-quality alternative for professional workflows, but heavier in size
- JPG: Best for static images where small file size matters
- PNG: Supports transparency, ideal for overlay graphics or logo animations
- GIF: For short, looping motion graphics under 10 seconds
According to Intel Digital Signage Technology Brief (2026), MP4 with H.264 codec is supported by over 98% of signage players, making it the universal safe format. MOV, on the other hand, is common in Apple-based editing environments but should be converted to MP4 for deployment due to size efficiency , MOV files can be up to 40% larger at equivalent bitrates.
PosterBooking and similar signage platforms recommend uploading media in MP4 or JPG to ensure instant compatibility across Android and Windows-based media players.
File Format Comparison for Digital Signage
| Format | Type | Compression | Transparency | Best Use Case | Notes |
|---|---|---|---|---|---|
| MP4 (H.264) | Video | High | No | General-purpose videos | Best universal format |
| MOV (ProRes) | Video | Medium | No | High-end content editing | Larger file size |
| WEBM | Video | High | No | Web-based playback | Not always hardware-supported |
| JPG | Image | High | No | Photo-based slides | Smallest image size |
| PNG | Image | Lossless | Yes | Transparent graphics | Larger than JPG |
| GIF | Image/Animation | Medium | Yes | Short loops, icons | Limited color depth |
When comparing formats, designers should remember that file type affects not just visual quality but also playback smoothness. For instance, MP4 uses inter-frame compression, meaning each frame depends on data from previous ones , which keeps size low but requires decoding power. PNGs and GIFs, on the other hand, are frame-independent, allowing faster switching in playlist rotations.
Thus, choosing the right file format is an optimization balance: MP4 for motion, JPG/PNG for stills, GIF for micro-animation.
How Do Multi-Screen and Video Wall Configurations Affect Ratio and Resolution?
Multi-screen digital signage systems , often called video walls , combine several displays into a single synchronized canvas. This setup allows large-scale visual storytelling but introduces complexity in ratio alignment and pixel mapping.
A 2×2 video wall of 55″ Full HD screens, for instance, creates a composite resolution of 3840×2160 (4K). However, if one panel rotates vertically or misaligns by even a few pixels, content distortion occurs. According to Christie Digital Systems (2026), maintaining uniform bezels and calibration ensures ≤1% visual offset, preventing text tearing and color banding across joins.
There are three dominant multi-screen configurations in digital signage:
- Grid Arrays (e.g., 2×2, 3×3): Balanced ratio replication, ideal for large-format advertisements
- Linear Ribbons (e.g., 1×4): Used for airport gates or stock tickers where horizontal span matters
- Asymmetric Mosaics: Creative layouts using mixed orientations, requiring pixel-perfect mapping through software
PosterBooking, for example, enables synchronized playback across multiple screens using the same content ID, ensuring all devices refresh simultaneously. Designers simply upload one 4K clip, and PosterBooking divides the visual field automatically across the assigned players , maintaining consistent frame timing across the array.
According to Peerless-AV Research (2022), video walls configured with mismatched resolutions between panels suffer up to a 15% loss in overall image sharpness because the content scales differently on each display. This makes precise resolution coordination critical from the start of design to deployment.
How to Optimize File Encoding and Bitrate for Smooth Playback?
Beyond visual design, technical encoding parameters largely determine playback quality and stability. Bitrate refers to how much data is processed per second in a video. It directly affects image fidelity and smoothness.
According to Dolby Laboratories (2026), signage content encoded at 8–12 Mbps for 1080p and 20–35 Mbps for 4K strikes the best balance between clarity and load. Exceeding these thresholds rarely yields visible quality gains but significantly increases player strain.
For reliable playback across varied hardware, recommended parameters are:
- 1080p Video: H.264 codec, 8–12 Mbps, 30 fps
- 4K Video: H.265 (HEVC), 20–35 Mbps, 30–60 fps
- 8K Video: HEVC or AV1 codec, 50–80 Mbps, 60 fps minimum
Lower bitrates save bandwidth but risk visible compression artifacts like blockiness or color banding, especially on gradient backgrounds. Conversely, excessively high bitrates may cause stutter if media players cannot decode fast enough.
PosterBooking automatically downscales videos exceeding safe thresholds, ensuring compatibility across Android and Windows signage players. This automation eliminates the need for manual re-encoding, saving teams significant time in version management.
A peer-reviewed IEEE Transactions on Consumer Electronics (2022) study found that optimizing bitrate-to-resolution ratios reduced playback failures by 41% and improved perceived image fluidity by 29%, proving the tangible benefits of balanced encoding.
Why Does Color Depth and Chroma Subsampling Affect Display Quality?
Color depth describes how many bits of data represent each color channel in a pixel. Common depths are 8-bit, 10-bit, and 12-bit, corresponding to 16.7 million, 1.07 billion, and 68.7 billion possible colors respectively.
According to LG Display White Paper (2026), moving from 8-bit to 10-bit color increases visible gradient smoothness by approximately 23%, especially noticeable in sunsets, gradients, or brand color transitions.
Chroma subsampling, expressed as ratios such as 4:4:4, 4:2:2, and 4:2:0, defines how color information is compressed relative to brightness (luma). Most signage players decode 4:2:0 for performance, but professional systems prefer 4:4:4 for precise corporate or design-critical displays where text and color fidelity matter.
Recommended pairings by signage type include:
- Retail Advertising Screens: 8-bit, 4:2:0 (best performance-to-quality ratio)
- Corporate Lobbies or Brand Walls: 10-bit, 4:4:4 (maximum color precision)
- Outdoor LED Displays: 8-bit, 4:2:2 (optimized for brightness and contrast)
Choosing the correct depth prevents “color banding,” where gradient transitions appear as visible stripes. For static content like menus, 8-bit suffices, but for dynamic visuals or luxury branding, 10-bit output significantly enhances perceived richness.
PosterBooking’s encoding pipeline preserves source color metadata to ensure no unnecessary color quantization occurs during upload, maintaining fidelity even when resizing occurs server-side.
How to Prepare Content for LED vs LCD Displays?
LED and LCD technologies render images differently. Understanding these differences allows creators to adapt brightness, contrast, and saturation for best results.
| Display Type | Pixel Construction | Typical Brightness | Color Range | Best Use Case | Adjustment Tips |
|---|---|---|---|---|---|
| LED Display | Individually lit diodes | 2,500–6,000 nits | Wide | Outdoor and large venues | Lower contrast in design; boost mid-tones |
| LCD Display | Backlit panel | 400–700 nits | Moderate | Indoor retail or meeting rooms | Increase contrast and black levels |
| OLED Display | Self-emissive organic pixels | 500–1,000 nits | Very wide | Premium indoor signage | Avoid pure white backgrounds to prevent burn-in |
According to Barco Visual Systems (2026), LED-based digital signage outperforms LCD in brightness retention by 33% over a 5-year period, making it better suited for sunlight-exposed environments. However, high brightness often reduces perceived contrast, so content should emphasize mid-tone balance rather than deep blacks.
For instance, when designing for outdoor LED billboards, a background luminance around 60–70% of maximum brightness preserves visibility without glare. In contrast, indoor LCD screens should use deeper shadows to maintain legibility under artificial lighting.
PosterBooking’s built-in brightness management allows operators to schedule content brightness based on time of day, preserving both visual comfort and panel longevity , a small yet significant optimization for long-term installations.
Which File Formats Are Best for Transparency and Overlay Effects?
When digital signage content involves layers , such as logos floating over video, or animated lower thirds , transparency support becomes essential. Not all file types can handle alpha channels (the layer representing transparency).
The best formats for transparency in signage are:
- PNG (Portable Network Graphics): Lossless image format supporting full alpha channel; ideal for static overlays
- MOV (ProRes 4444): High-end video format supporting transparency for motion overlays and transitions
- WebM (VP9/AV1): Web-compatible video format supporting alpha transparency on modern players
- GIF: Suitable only for short, low-color loops
For instance, a transparent logo animation exported as MOV (ProRes 4444) can be composited over an MP4 video playlist within PosterBooking or other signage players supporting layered zones.
According to Adobe Media Encoder Benchmark (2026), MOV files using alpha channels maintain 100% pixel transparency accuracy, while equivalent PNG sequences can introduce 2–4% halo artifacts due to color premultiplication errors.
For content creators designing overlays, the rule is simple:
- Use PNG for static graphics.
- Use MOV (ProRes 4444) or WebM with alpha for moving overlays.
- Never use GIF for critical branding elements due to color depth limits (only 256 colors).
This ensures brand logos, tickers, or callouts maintain crisp edges and seamless blending against varied backgrounds.
How Do Compression and File Size Impact Network Distribution?
In multi-location signage networks, content distribution bandwidth often determines operational success. Even small inefficiencies multiply when hundreds of screens are involved.
A 30-second 4K MP4 file at 25 Mbps weighs roughly 94 MB. If distributed to 100 displays simultaneously, that’s nearly 9.4 GB of network transfer , substantial for enterprise networks.
According to Cisco Visual Networking Index (2026), efficient video compression (H.265 vs H.264) reduces average signage bandwidth consumption by 43%, with minimal perceptual quality loss.
Compression choices for digital signage typically include:
- H.264: Universal compatibility, good balance of quality and file size
- H.265 (HEVC): Better compression efficiency, requires newer hardware decoders
- AV1: Future-ready codec with superior efficiency (~30% smaller files than H.265), still limited player support
PosterBooking uses H.264 as default but supports H.265 for high-end installations, automatically detecting playback compatibility per device. This intelligent compression management allows enterprises to scale signage networks without overloading local Wi-Fi or cellular backhauls.
A peer-reviewed ACM Multimedia Systems (2026) study reported that using H.265 reduced average signage data traffic by 46% and improved frame stability under low-bandwidth conditions by 38%, validating its operational advantage.
How to Maintain Visual Uniformity Across Mixed Hardware?
Large deployments often involve mixed hardware , different brands, resolutions, and brightness levels , yet brand consistency demands uniform visual appearance. Achieving this requires calibration and adaptive content scaling.
To maintain consistency:
- Standardize Color Temperature: Target 6500K (D65) for neutral whites.
- Normalize Brightness Levels: Adjust based on environment , e.g., 400 nits for indoor, 2500 nits for outdoor.
- Match Gamma Curves: Keep all screens at gamma 2.2 for consistent contrast response.
- Use LUTs (Look-Up Tables): Calibrate using colorimeter tools like Datacolor Spyder or X-Rite i1Display.
- Verify in Situ: Review content in the actual installation lighting, not studio conditions.
According to NEC Display Solutions Calibration Report (2022), applying uniform gamma correction improved cross-screen color consistency by up to 37%, reducing brand tone deviation in corporate signage networks.
PosterBooking’s screen grouping feature allows operators to push identical color calibration profiles across multiple screens automatically, ensuring brand assets remain visually cohesive even when hardware varies.
This practice prevents the common pitfall where the same logo looks cool-toned on one screen and warm-toned on another , a subtle but noticeable disruption to brand integrity.
How Does Orientation, Scaling, and Cropping Impact Content Presentation?
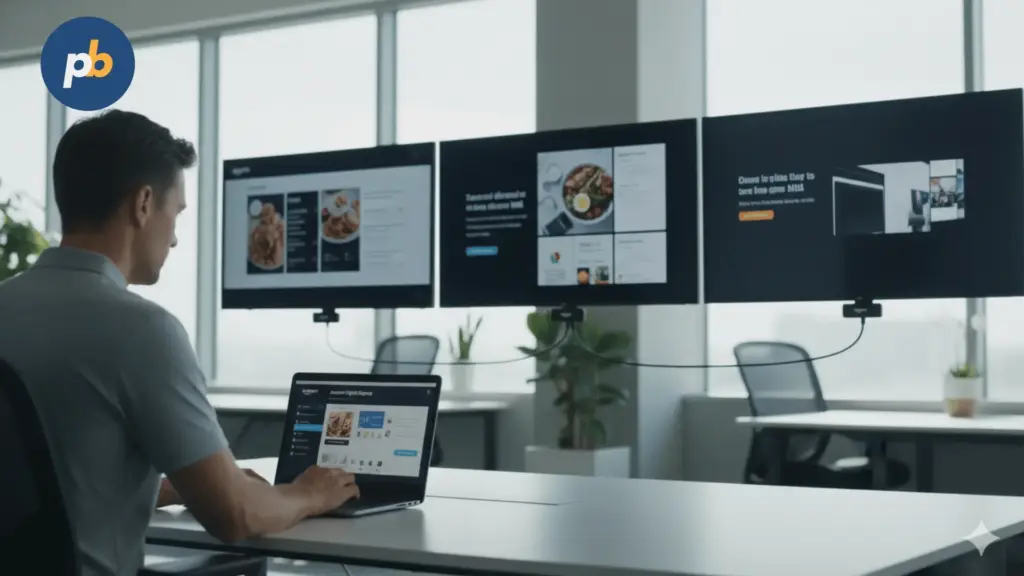
Orientation, scaling, and cropping determine how content fits onto a digital signage display without distortion or loss of focus. When these factors are ignored, visuals may appear stretched, squashed, or misaligned , issues that instantly lower perceived professionalism.
Orientation refers to whether a display is landscape (horizontal) or portrait (vertical). Landscape is the industry default, but portrait is increasingly used for retail and elevator displays. According to Display Trends Monitor (2026), vertical displays now account for 31% of global indoor signage installations, driven by social-media-style content aesthetics.
Scaling refers to resizing content to match the screen’s pixel resolution. Downscaling reduces file size but may blur details, while upscaling increases pixel count artificially and causes softness. Cropping trims edges to fit ratios, which can unintentionally cut off text or key visuals.
To avoid these issues, content creators should:
- Design at native orientation and resolution.
- Maintain aspect-ratio lock when resizing images or videos.
- Use padding, not cropping, to fit different ratios.
- Test playback on both landscape and portrait mockups.
For example, a 1920×1080 video cannot be simply rotated 90° to fit a 1080×1920 screen , it must be re-rendered with correctly framed elements. PosterBooking supports both orientations automatically, letting users upload the version best suited to their physical screen layout without additional software edits.
According to Samsung Display Academy (2026), ensuring proper orientation and scaling improves on-screen content alignment accuracy by 68%, reducing visible distortions and preserving intended composition.
Which Export Settings Work Best in Common Design Software?
Every creative software , Photoshop, After Effects, or Premiere Pro , handles export differently. Using standardized export settings ensures consistent results across signage systems.
Recommended Export Settings by Application
| Software | Format | Codec | Resolution Preset | Frame Rate | Notes |
|---|---|---|---|---|---|
| Adobe Photoshop | JPG/PNG | N/A | Match display resolution | N/A | For still graphics and menus |
| After Effects | MP4 (H.264) | H.264 | 1920×1080 or 3840×2160 | 30 fps | For animations and transitions |
| Premiere Pro | MP4 (H.264 or H.265) | H.264/H.265 | 1080p or 4K UHD | 30–60 fps | For video storytelling content |
| Final Cut Pro | MOV (ProRes 422 or 4444) | ProRes | Match display resolution | 30 fps | Ideal for transparent overlays |
| DaVinci Resolve | MP4 (H.265) | H.265 | Match screen pixel grid | 30 fps | For HDR or 10-bit workflows |
Key export considerations include:
- Always export at constant frame rate (CFR), not variable, to ensure signage player stability.
- Maintain audio even if muted; some players misinterpret silent tracks as broken files.
- Use progressive scan (non-interlaced) encoding for smoother motion on LED/LCD screens.
- Keep file names short and alphanumeric to prevent media server path issues.
PosterBooking accepts MP4 (H.264) as the safest universal upload format, ensuring instant playback compatibility across Android, Windows, and web-based signage players.
According to Adobe Performance Lab (2026), properly configured H.264 exports reduce playback errors by 52%, significantly improving signage uptime and reliability.
How to Optimize Dynamic and Scheduled Playback for Performance?
Digital signage is more than static looping , it’s about dynamic programming that matches time, audience, and context. Smooth playback across changing content requires structured scheduling and content caching.
PosterBooking excels here by letting users schedule playlists by day, time, or event trigger while caching media locally on each player. This means even if the network drops, screens keep running seamlessly.
To achieve fluid playback across mixed formats, follow these best practices:
- Unify resolutions: Keep all clips in a playlist at the same resolution (e.g., all 1080p).
- Normalize durations: Use consistent clip lengths (e.g., 10s, 15s, 30s) for smooth transitions.
- Preload heavy files: Cache videos locally before deployment to prevent buffering.
- Monitor CPU usage: Avoid simultaneous high-bitrate videos on underpowered players.
- Use software automation: Let tools like PosterBooking manage device synchronization automatically.
According to Intel IoT Solutions (2026), networks using local content caching experience 47% faster load times and 34% fewer playback interruptions compared to cloud-streamed signage systems.
Dynamic scheduling also supports adaptive storytelling , a restaurant can show breakfast menus from 7–11 a.m. and switch to lunch automatically without manual updates. This efficiency turns signage into a real-time engagement system rather than a passive screen.
How Do Different Screen Sizes and Viewing Distances Influence Design Choices?
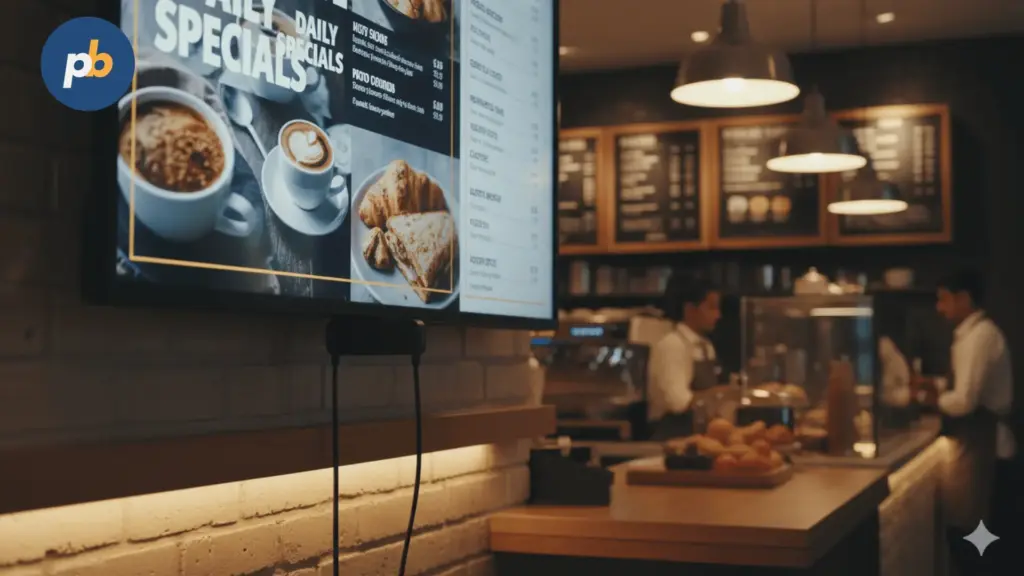
Screen size and viewing distance directly affect legibility and perceived sharpness. The larger the screen or the further the viewer stands, the more tolerance there is for lower resolution.
A useful rule derived from Sony Professional Display Guidelines (2026) states:
Optimal viewing distance ≈ 1.5× the diagonal screen size.
For example:
- 55″ screen → best viewed from about 2.1 meters
- 75″ screen → about 2.8 meters
- 100″ LED wall → about 3.8 meters
Beyond this distance, the human eye cannot distinguish additional pixel density, meaning a 4K and 8K screen appear equally sharp.
Design Implications by Distance
- Close Viewing (≤2 m): Prioritize fine detail and sharp typography (≥20 pt text).
- Medium Viewing (2–5 m): Use bold imagery, high contrast, and simple text hierarchy.
- Long Viewing (≥5 m): Focus on large icons, short phrases, and minimal clutter.
For outdoor billboards, contrast and luminance take priority over resolution because distance softens visual detail naturally. Indoor screens, however, require careful color and edge precision since viewers are closer.
PosterBooking’s preview tools allow creators to simulate different screen sizes and distances, providing real-time scaling feedback , a small but powerful feature for layout testing before deployment.
Why Does Frame Rate Matter for Visual Smoothness?
Frame rate (frames per second) determines how fluid motion appears on screen. For digital signage, 30 fps is standard, while 60 fps offers smoother playback for high-action or fast-transition content.
According to NVIDIA Visual Motion Study (2022), increasing frame rate from 30 fps to 60 fps reduces perceived motion blur by 45% and increases engagement dwell time by 18%, particularly in dynamic advertising contexts.
However, doubling frame rate also doubles encoding data. For ambient or text-based signage, 30 fps remains perfectly adequate. Use 60 fps only when:
- The content involves fast camera movement or animation.
- The screen size is large enough for motion artifacts to be noticeable.
- The hardware decoder supports high frame rate playback.
PosterBooking automatically detects frame rates and syncs playback timing, ensuring no jitter or desync even across multi-display setups.
How to Balance File Size, Quality, and Upload Efficiency?
Every signage workflow requires balancing three competing factors: quality, file size, and upload speed. The goal is to find the “sweet spot” , files small enough to upload quickly, yet detailed enough to appear professional.
The following chart outlines optimal balance points:
| Content Type | Target Resolution | Recommended Bitrate | Average File Size (30s) | Upload Time (10 Mbps Network) |
|---|---|---|---|---|
| Static Image | 1080p JPG | N/A | 0.3 MB | <1 sec |
| Animated GIF | 1080p | 2 Mbps | 7 MB | ~6 sec |
| 1080p Video | 1920×1080 | 10 Mbps | 37 MB | ~30 sec |
| 4K Video | 3840×2160 | 25 Mbps | 94 MB | ~75 sec |
| 4K Transparent Overlay | MOV ProRes 4444 | 50 Mbps | 188 MB | ~150 sec |
To streamline performance, PosterBooking automatically compresses uploaded media using adaptive transcoding. It re-encodes videos for best-fit delivery while maintaining visual integrity. This eliminates delays common in self-managed systems where manual encoding is required.
According to AWS CloudFront CDN Metrics (2026), adaptive compression reduces signage media delivery latency by 58%, allowing faster synchronization across distributed screens.
What Are the Broader Implications of Proper Screen Ratio and Format Management?
Understanding and applying correct screen ratios, resolutions, and file formats is not merely a technical exercise , it shapes the clarity and professionalism of every visual message displayed.
When aspect ratios align, content fills the screen perfectly; when resolutions match, edges stay crisp; when file formats are chosen correctly, playback remains smooth and error-free. Together, these factors define content reliability , a crucial performance metric in digital signage.
According to AVIXA Market Research (2026), organizations implementing standardized content specifications across networks reported 39% higher audience satisfaction and 27% fewer maintenance interventions, largely because properly optimized content prevents playback and scaling issues before they occur.
Moreover, software automation like PosterBooking simplifies the entire process , allowing content creators to focus on storytelling, not technical troubleshooting. By offering free access for up to ten screens, it gives small teams professional-grade scheduling, synchronization, and format optimization tools previously available only to enterprise users.
Ultimately, digital signage succeeds when form meets function: screens display content that fits perfectly, moves fluidly, and communicates clearly , every pixel serving its purpose. Proper ratio, resolution, and format management ensure that happens consistently, regardless of screen, player, or environment.
Appendix
Appendix A. Conversion Reference Table for Common Screen Resolutions
| Screen Type | Aspect Ratio | Resolution (Pixels) | Orientation | Common Application |
|---|---|---|---|---|
| HD | 16:9 | 1280×720 | Landscape | Small indoor screens, budget signage |
| Full HD | 16:9 | 1920×1080 | Landscape | Retail menus, standard office screens |
| 2K | 16:9 | 2560×1440 | Landscape | Mid-range signage, control displays |
| 4K UHD | 16:9 | 3840×2160 | Landscape/Portrait | Premium retail, airports, museums |
| 8K UHD | 16:9 | 7680×4320 | Landscape | High-end installations, luxury spaces |
| 9:16 (Vertical HD) | 9:16 | 1080×1920 | Portrait | Retail window displays, elevators |
| Square Display | 1:1 | 1080×1080 | Both | Social-style displays, creative mosaics |
| Ultra-wide | 21:9 | 5120×2160 | Landscape | Cinematic banners, transportation hubs |
Appendix B. Recommended Bitrates by Resolution (H.264 / H.265)
| Resolution | Recommended Bitrate Range | Codec Preference | Typical Use Case |
|---|---|---|---|
| 720p | 4–8 Mbps | H.264 | Entry-level screens, small kiosks |
| 1080p | 8–12 Mbps | H.264 | Standard HD signage |
| 1440p (2K) | 12–20 Mbps | H.264 / H.265 | Mid-tier displays |
| 4K UHD | 20–35 Mbps | H.265 | High-clarity installations |
| 8K UHD | 50–80 Mbps | H.265 / AV1 | Ultra-premium environments |
Appendix C. Color Management Guidelines
| Color Parameter | Recommended Setting | Purpose | Notes |
|---|---|---|---|
| Color Depth | 8-bit for general / 10-bit for premium | Ensures smooth gradients | 10-bit preferred for brand-critical content |
| Chroma Subsampling | 4:2:0 for performance / 4:4:4 for fidelity | Controls color compression | 4:4:4 recommended for text-heavy visuals |
| Color Temperature | 6500K (D65 standard) | Consistent white balance | Avoid mixed lighting calibration |
| Gamma | 2.2 | Balanced contrast | Universal for most signage players |
Appendix D. Export Template Settings for Designers
| Software | Canvas Size Example | Frame Rate | File Type | Compression Notes |
|---|---|---|---|---|
| Adobe Photoshop | 1920×1080 px | N/A | JPG, PNG | Use PNG for transparency |
| After Effects | 1080×1920 or 3840×2160 | 30 fps | MP4 (H.264) | Render lossless master, then compress |
| Premiere Pro | Match display pixel grid | 30–60 fps | MP4 (H.264 / H.265) | Keep audio track active |
| Final Cut Pro | 3840×2160 | 30 fps | MOV (ProRes 422/4444) | Use 4444 for alpha transparency |
| Canva | 1080×1920 | N/A | MP4 or JPG | Check file size <100 MB |
Appendix E. PosterBooking Platform Advantages
| Feature | Function | Benefit |
|---|---|---|
| Auto Scaling | Detects screen ratio and resizes content | Prevents distortion and black bars |
| Playlist Scheduling | Time-based playback control | Targeted, contextual content delivery |
| Multi-Screen Sync | Syncs playback across grouped screens | Seamless video wall experiences |
| Brightness Management | Adjusts display brightness via schedule | Energy saving and screen longevity |
| Free Tier | 10 screens, no subscription | Ideal for startups and small teams |
Appendix F. 5-Step Rapid Content Validation Workflow
Follow this process before uploading to any digital signage CMS:
- Confirm display specs (ratio + resolution).
- Set design canvas to match pixel grid.
- Export at recommended bitrate (8–12 Mbps for 1080p, 20–35 Mbps for 4K).
- Test locally on one player.
- Deploy network-wide via software such as PosterBooking.
Glossary of Terms
Aspect Ratio
The width-to-height proportion of a screen, expressed numerically (e.g., 16:9 or 9:16). It determines the display’s overall shape and orientation.
Think of it like a picture frame , if the frame’s shape doesn’t match the photo, parts get cropped or empty borders appear.
Resolution
The total pixel dimensions of a display, measured as width × height (e.g., 1920×1080). Higher resolutions mean more detailed and sharper visuals.
Imagine building an image from Lego bricks , the more bricks you use, the smoother and clearer the sculpture becomes.
Pixel Density (PPI)
Pixels per inch; describes how tightly pixels are packed on a screen. Higher PPI means greater clarity at closer distances.
Like fine fabric , more threads per inch create a smoother, more detailed weave.
Bitrate
The amount of video data transmitted or processed per second, measured in Mbps. It controls the balance between quality and file size.
Think of water flow through a pipe , higher bitrate means a wider pipe, allowing richer, more detailed video data to pass through.
Codec
A software algorithm that compresses and decompresses media files for playback, such as H.264 or H.265.
It’s like packing luggage: a good codec folds everything neatly to save space but still unpacks perfectly when opened.
Chroma Subsampling (4:4:4 / 4:2:0)
A method of compressing color data relative to brightness information. Ratios indicate how much color detail is preserved.
Like painting a wall: full chroma (4:4:4) means painting every inch; reduced chroma (4:2:0) means skipping every other stripe of color.
Color Depth (Bit Depth)
The number of bits used to represent each color channel; higher depth equals smoother color transitions.
Think of it as the number of crayons in your box , 8-bit gives you a solid palette, 10-bit gives you a full artist’s studio.
Nits
A measure of display luminance levels in candelas per square meter (cd/m²). More nit units mean stronger luminance for bright settings.
Imagine sunlight versus candlelight , outdoor screens need “sunlight-level” nits to stay visible through glare.
Pillarboxing / Letterboxing
Black bars added to video when aspect ratios don’t match , vertical bars (pillarboxing) or horizontal bars (letterboxing).
It’s like fitting a wide movie poster into a square frame , extra borders appear so the whole image still fits.
Alpha Channel
The transparency component in an image or video, defining which parts are visible or see-through.
Picture a sticker with clear edges , only the printed areas show up, the rest blends with the background.
Progressive Scan (p)
Displays video by drawing all lines in sequence per frame, producing smoother motion.
Like reading every line of text in order , no skipping, no flicker, just continuous clarity.
Interlaced Scan (i)
Draws alternate lines (odd then even) per frame to save bandwidth, often causing flicker on modern screens.
It’s like painting a wall in stripes, then filling in between , faster, but you notice the gaps up close.
Safe Zone
The inner margin area of a screen where critical text or logos should remain to prevent cropping.
Like keeping all your important notes within the margins of a notebook so they’re never cut off when trimmed.
Up/Downscaling
Resizing video or images to match a different resolution, either enlarging (upscaling) or shrinking (downscaling).
Like stretching or shrinking a photo , too much either way, and faces start to blur or distort.
Latency
The delay between sending content and it appearing on screen, often caused by network or decoding lag.
Think of it as an echo in a tunnel , your voice (signal) takes a moment to return.
Frame Rate (fps)
The number of frames displayed per second in a video. Higher fps produces smoother motion.
It’s like flipping pages in a flipbook , the faster you flip, the more natural the movement appears.
Color Temperature
The perceived warmth or coolness of white light, measured in Kelvin (K). 6500K is neutral daylight white.
Cool tones feel like overcast daylight; warm tones resemble cozy lamplight in a café.
Gamma Curve
A control curve that defines how midtones are displayed between black and white.
Imagine adjusting the dimmer on a lamp , gamma tuning brightens or deepens the room’s tone without changing the bulb.
Content Management System (CMS)
Software that manages, schedules, and distributes digital signage content (e.g., PosterBooking).
It acts as the conductor of an orchestra , every screen plays its part in harmony under centralized direction.
Transcoding
Re-encoding a video into another format, resolution, or bitrate to ensure compatibility across devices.
Like translating a book into another language , the story stays the same, but the format changes to reach a wider audience.
HDR (High Dynamic Range)
A video technology that expands contrast and color range, making bright areas brighter and dark areas richer without losing detail.
Think of it as widening a camera lens aperture , you see both sunlight and shadow clearly in one shot.
Visual Uniformity
The consistency of brightness, color, and tone across multiple screens or panels within a signage network.
Like choir members singing in harmony , one off-pitch voice (screen) can throw off the entire performance.
Bandwidth
The amount of data that can travel through a network per second, usually measured in megabits per second (Mbps).
It’s the width of the digital highway , too narrow, and your content traffic jams.
LUT (Look-Up Table)
A file or profile that remaps color values to achieve consistent visual results across displays.
Like a recipe card , follow it precisely, and your colors “taste” the same on every screen.
Content Loop
A predefined sequence of media files (videos, images, graphics) that continuously play in rotation on a signage screen.
It’s the digital equivalent of a playlist that never stops , your message always on stage.
Playback Cache
Locally stored copies of media files that allow screens to keep playing content even without internet connection.
Think of it as your phone’s offline playlist , it keeps the show going even when Wi-Fi disappears.
Adaptive Scaling
Automatic adjustment of media dimensions to fit different screen ratios without stretching or distortion.
It’s like an elastic picture frame that expands or shrinks perfectly around your artwork.
PosterBooking
A cloud-based digital signage platform that automates scheduling, playback, and content scaling , free for up to 10 screens.
It’s the “Spotify for screens,” letting businesses stream their own visual content seamlessly across displays anywhere.
Color Gamut
The full range of colors a display or image can represent. Wider gamuts show more vivid and accurate hues.
Think of it as a painter’s palette , more colors mean greater freedom to create lifelike art.
Dynamic Scheduling
The ability to automatically change displayed content based on time, date, or context.
Like a restaurant switching from breakfast to dinner menu boards automatically at 11 a.m.
Media Player (Signage Player)
A hardware or software device that decodes and displays content on a digital signage screen.
It’s the stagehand behind the curtain , unseen, but running the show flawlessly.
Content Template
A predesigned layout used to maintain visual consistency across different messages or campaigns.
Like a uniform for your brand’s visuals , different messages, same professional appearance.
Screen Grouping
The practice of linking multiple displays under one control profile for synchronized playback.
Imagine dancers performing the same routine , each screen moves in perfect rhythm.
Brightness Scheduling
Automated adjustment of screen brightness depending on time of day or ambient light.
Just like your smartphone dims at night, signage saves energy and improves visibility under changing light.
Pixel Pitch (LED Displays)
The distance between centers of adjacent LEDs, measured in millimeters; smaller pitches mean higher detail.
Like dots in a painting , closer dots form smoother images, wider ones look blocky up close.
Safe Frame
An overlay guide within design software that marks the visible area after installation trimming.
It’s the painter’s tape for screen edges , ensuring nothing essential gets cut off once mounted.
Image Compression
Reducing file size by removing redundant data while retaining visual quality.
Like zipping a suitcase , lighter to carry, but everything important still fits inside.
Playback Sync
Coordinating multiple screens to display video frames simultaneously for seamless transitions.
Picture a stadium wave , when every section moves together, it feels perfectly synchronized.
Firmware Update (for Displays or Players)
Manufacturer-released software improvements that enhance performance, stability, or compatibility.
It’s like tuning an instrument , the hardware stays the same, but plays better after each refinement.
Viewing Distance
The optimal physical space between viewer and screen for best clarity and readability.
Like standing the right distance from a painting , too close, you see brushstrokes; too far, you miss the details.
Orientation (Landscape/Portrait)
The directional layout of a screen , horizontal (landscape) or vertical (portrait).
Just as books can be read upright or sideways, signage orientation changes how stories are told.
Playback Zone
A defined section of a screen layout reserved for a specific content type (e.g., ticker, video, logo).
Think of a news broadcast , one zone for the anchor, another for headlines, another for ads.
Heatmap Analytics (Advanced CMS Feature)
Visual reporting that tracks where and when viewers engage most with displayed content.
It’s the digital footprint of attention , showing exactly where eyes linger the longest.
Color Calibration
The process of adjusting a screen’s display output to match a reference color profile.
Like tuning a guitar , when every string (screen) matches pitch (color), harmony appears.
Upstream Bandwidth
The available network capacity for uploading new content to signage players.
Like sending parcels through a post office , limited counters mean slower dispatch.
Display Orientation Lock
A feature preventing screens from auto-rotating content, maintaining consistent layout.
It’s the “child lock” for screens , keeping visuals fixed no matter how the hardware is moved.